Analytics at GitHub
In the interest of getting back into writing, I want to break the seal with a simple “what have I been up to and thinking about lately” style post. Hopefully future topics will be more focused and frequent.
For the past year, I have been working on data and analytics at GitHub. We have grown from 1 to 4 full time people, with really close involvement from a few other people technically on other teams.
It has been an interesting year full of a lot of learning, so I figured I would kick things off with a big summary of what we have built and why.
In the Beginning
I started with a single Rails app for collecting, processing and reporting on traffic data. The end goal was repository traffic graphs for the masses.
The lesson I learned while building Gauges was that while you need incremental reports for fast reads, there are few things more valuable than the raw data. Knowing this, I started by using Cassandra to store all the raw page views, in addition to building up some incremental “indexes” with Cassandra’s distributed counters for faster reads.
Note that up to this point in the article, I have only used “I”. It is always better to work together than alone and after a month or two of working alone, I knew I needed to find some other people excited about data and analytics.
At the January 2013 Summit, I met Derek Greentree who was working on making activity data query-able and we decided to join forces. With his knowledge of batch reporting and hadoop, it made far more sense for us to focus on batch reporting on an interval (hourly, daily) and worry about the more real-time updates later. Start with correct and move towards up-to-date. We stopped performing the counts in Cassandra and only stored the raw data.
Apply the Unix Philosphy
Also around this time, we realized that having all functionality in one application was asking for trouble down the road. We knew we would end up with a monorail of regret that opposed our love of the unix philosophy. We broke down the single application into a few components – collecting, processing and reporting.
The collector became a Rails app with one purpose, receive events and queue them in Kestrel (which I used on Gauges, had no issues with and thus decided to use on this project as well).
The processor pulled from the queue and stored the raw data in Cassandra. The other component of processing (hadoop) then iterated the raw data on intervals and turned it into aggregated “indexes” that would be useful for fast reads (ie: page views per repository per hour).
The reporter became a Rails app with one purpose as well, to receive API requests from github.com and read the data required to fulfill the request from Cassandra.
Each of these apps are small and focused, connected by a queue or data store. The collector and processor are connected by Kestrel. The processor and reporter are connected by Cassandra. Each app is an input to an output. Maybe not perfectly conforming the unix philosophy, but our choices felt pragmatic.
Apply Schema and Versioning
Around this time, Dietrich Featherston joined the team. We had a small bit of schema (app, event type, timestamp, payload), but he urged us to go a bit further. We split out payload into dimensions (flat map of string keys and values) and measures (flat map of string keys and integer values). This was the first and only schema change we have made, which I think shows how flexible it is. A typical event looks something like this in JSON:
{
  "app": "github",
  "event_type": "page_view",
  "timestamp": ...,
  "data": {
    "dimensions": {
      "repository_id": 1234,
      ...
    },
    "measures": {
      "performance_timing_navigation_start": 23,
      ...
    },
    "version": 2
  }
}
As you can see above, we learned our lesson with regards to schema changes and added a schema version to the data/payload. Some may say we did not learn our lesson, as we are still using JSON over thrift or protobuf, but I will leave that judgement up to the reader.
Apply the Append Only Log
Relatively quickly, we realized that storing all raw data in Cassandra forever was going to be cost-prohibitive. One of the things you learn really quickly when doing analytics is that there is a big usage drop off based on recency (ie: people care way more about this week or month verse all time). You need to plan for cold, luke-warm, and hot data accordingly.
Around this time, Andy Lindeman joined the team. Almost immediately, he went ham on a downstream consumer of our queue named Gulch. For those that are not aware, Kestrel supports fanout queues.
Continuing with our unix philosophy, Gulch is a tiny go daemon that accepts events from a source (kestrel) and pipes them to a sink (file system). Gulch’s only job is to append events to files as fast as it can.
Each event is received from kestrel using reliable reads. In addition to reliable reads, gulch performs an fsync on an interval (currently every second), similar to any database out there, to limit data loss in the event of failure. In addition to reliable reads and fsync, we run a backup instance of gulch that does everything our primary gulch does, except actually push the flat files to S3.
In the event of a primary gulch failure, we can flip the switch to the backup through manual intervention. We chose manual over automatic because we have not had a failure at this point and would like to see a few failures before we attempt to automate anything.
The files are under a directory structure that is :app/:event_type/%Y-%m-%d and are named with the hour followed by a random UUID. Files are written to until they reach a particular size or the hour ends, at which point they are compressed and pushed to S3 (by good ol’ cron, with a similar bucket structure).
Once we felt comfortable with gulch and S3 for permanent storage of the raw data, we used Hadoop to migrate the raw data from Cassandra to S3 in the same format as gulch and stopped writing raw data to Cassandra.
Gulch is going on six months in production and has written over 2TB of events to disk quite un-event-fully (see what I did there…). Every few months we have to tweak either gulch or its setup a bit due to an increase of data coming in, but other than that, gulch and go have been downright boring in production, in a good way.
Traffic Graphs
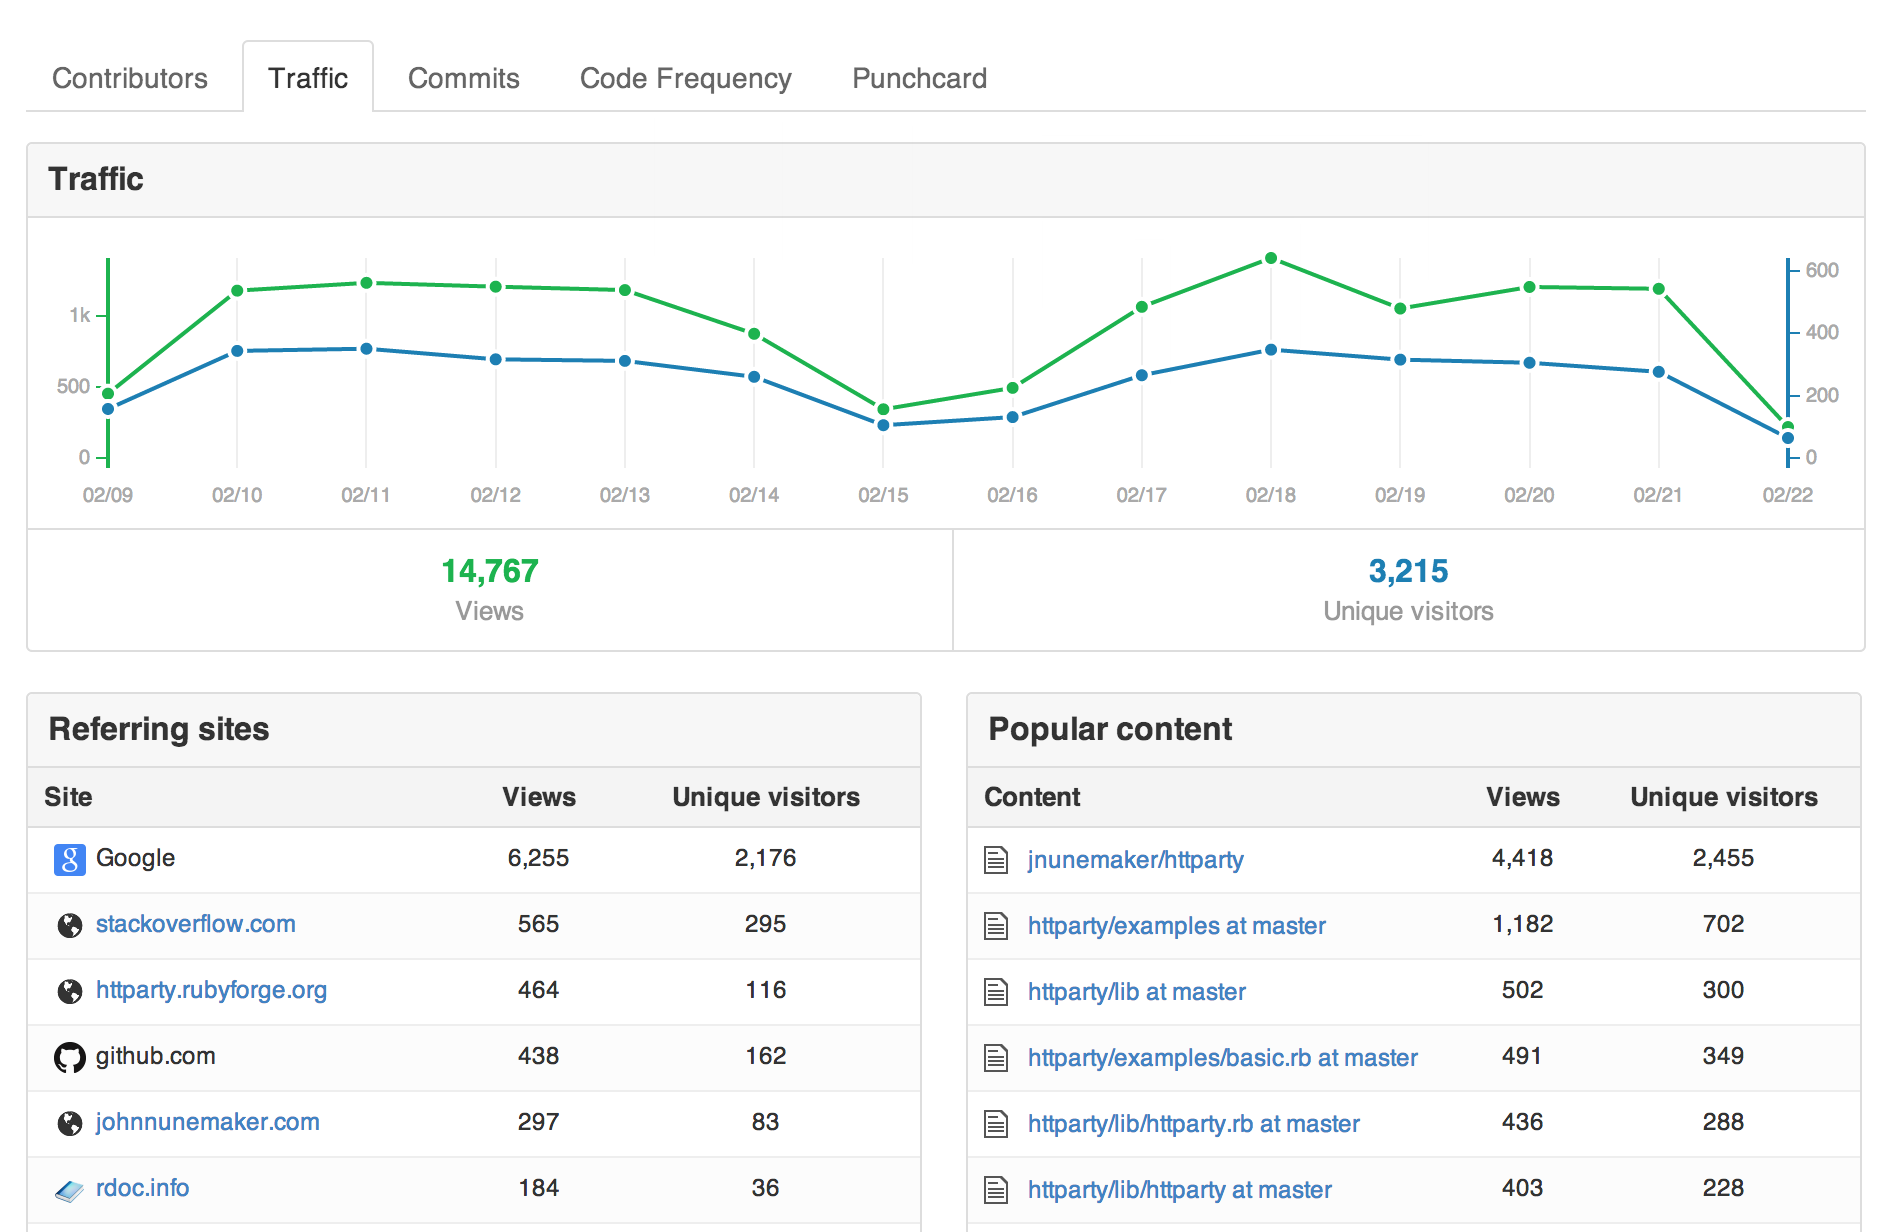
By November, we were all feeling the withdrawals of shipping features to the general GitHub population, so we lasered our focus in on shipping traffic graphs. We dark shipped requests from GitHub.com to the analytics API at a rate that was much higher than we expected to actually receive. Over the course of a few weeks, we tuned responses and declared the feature ready to go.
The first week back to work in January (post-Christmas break), traffic graphs launched and they have chugged along with no production impact on GitHub.com and, equally important, people seem to really dig them, which is fantastic.
Traffic graphs are the first public or private feature built on our data pipeline. Events go into the collector, get queued in Kestrel, processed to disk by gulch, pushed to S3 by cron, pulled from S3 and crunched by Hadoop which dumps report output into Cassandra, and finally served to github.com through a Rails API which reads from Cassandra.
For the visual folks, here is an ascii flow of the system:
+-----------------------------------------+
         http in           http out       |
     +-------------+   +-------------+    |
     |  collector  |   |  reporter   |    |  API
     +------+------+   +-------------+    |  (for github.com
            |                 ^           |   and other apps)
            |                 | +---------+
            |                 | +---------+
            v                 |           |
     +-------------+   +------+------+    |
     |   kestrel   |   |  cassandra  |    |
     +------+------+   +-------------+    |
            |                 ^           |
            |                 |           |
            |                 |           |
            v                 |           |
     +-------------+   +------+------+    |  Internal
     |    gulch    |   | hadoop/hive |    |  (parts are swappable
     +------+------+   +-------------+    |   by analytics team)
            |                 ^           |
            |                 |           |
            v                 |           |
     +-------------+          |           |
     |   AWS S3    +----------+           |
     +-------------+                      |
                                          |
+-----------------------------------------+
You might be thinking at this point that we built a hammer where a screwdriver would have sufficed. Read on and I will explain a bit more about what we really created and how I see traffic graphs as a proof of concept feature built on top.
Back to the Log
What started as a solution for traffic graphs very naturally morphed into a data collection and processing pipeline. The morph happened not out of technical wankery, but because we saw how useful it was to pipe page views to S3 and then ask random questions of that data with Hive/Hadoop. Seeing how useful this was, we wanted it to work for any event related data.
The funny thing is, I was so busy shipping traffic graphs, that I completely missed Jay Kreps mid-December post titled The Log (go read it now, sooooooo good). The end of January, we had an analytics mini-summit where the entire team met up at GitHub HQ in SF. Several of us had not met face to face and it was time.
On the flight out, I read Jay’s post and realized that what he described was exactly what we have been working on (or at least what I envisioned/hoped the system would become). Though our system is way behind what LinkedIn has built, he put into words the thoughts that have been swimming around my head for the past year.
The Goal: Make the Data Available
I believe this mundane problem of “making the data available” is one of the more valuable things an organization can focus on.
As Jay says, making data available is really important. By building a system focused on a deliverable (traffic graphs), but occasionally taking a step back to ensure that what we built was re-usable, we created a way to make data more available to GitHub.
Step 1: Making Capturing Data Easy
In my experience, most organizations have huge holes in the base of this pyramid—they lack reliable complete data flow—but want to jump directly to advanced data modeling techniques. This is completely backwards.
Truth. Before you can start doing valuable reporting and predicting, you need to have reliable collection. Our collector and queue were the first things we setup and started pumping data through.
Once these basic needs of capturing data in a uniform way are taken care of it is reasonable to work on infrastructure to process this data in various ways—MapReduce, real-time query systems, etc.
I would say we (at GitHub) now have a version of this. We have a simple way to capture data (HTTP requests with single or batch of events), but we definitely are looking to up our game in making it more simple to process this data in various ways.
Step 2: Improve Visualizing, Reporting and Predicting
Finally, concentration can shift to more sophisticated processing—better visualization, reporting, and algorithmic processing and prediction.
I see this happening at GitHub. Since the mini-summit, we have been working on more visibility into all this data internally at GitHub, so we can better serve you (people using GitHub) and getting more event data into the pipeline, as the proof of concept (traffic graphs) was a great success.
Closing Thoughts
For any business, the process of collecting data, measuring performance, making changes, and reviewing if those changes were successful is really important.
Start with collecting. Reliable data collection is a huge part being able to measure. Raw data is valuable and not terribly hard to collect or prohibitively expensive to store (for most of us). Once collection is solid, move on to reporting and visualizing the collected data.
Also, I would be remiss not to explicitly mention all of the work above was completed by a team, not by me individually (though I tried to point that out implicitly and explicitly above as well). Think of me as the scribe who has above average knowledge, when compared to other scribes, of programming, databases, and system building.
I am really excited about the future of GitHub, especially with regards to what the analytics team is up to, so rest assured there are more posts to come.